Chart Component
ABP Chart component exposed by @abp/ng.components/chart.js is based on charts.js v3+. You don't need to install the chart.js package. Since the @abp/ng.components is dependent on the chart.js, the package is already installed in your project.
Chart component loads
chart.jsscript lazy. So it does not increase the bundle size.
How to Use
First of all, need to import the ChartModule to your feature module as follows:
// your-feature.module.ts

import { ChartModule } from '@abp/ng.components/chart.js';
import { ChartDemoComponent } from './chart-demo.component';

@NgModule({
  imports: [
    ChartModule,
    // ...
  ],
  declarations: [ChartDemoComponent],
  // ...
})
export class YourFeatureModule {}
Then, abp-chart component can be used. See an example:
// chart-demo.component.ts

import { Component } from '@angular/core';

@Component({
  selector: 'app-chart-demo',
  template: ` <abp-chart type="pie" [data]="data"></abp-chart> `,
})
export class ChartDemoComponent {
  data = {
    labels: ['Data 1', 'Data 2', 'Data 3'],
    datasets: [
      {
        label: 'Dataset 1',
        data: [40, 15, 45],
        backgroundColor: ['#ff7675', '#fdcb6e', '#0984e3'],
      },
    ],
  };
}
Important Note: Changing the chart data without creating a new data instance does not trigger change detection. In order to chart to redraw itself, a new data object needs to be created.
See the result:

Examples
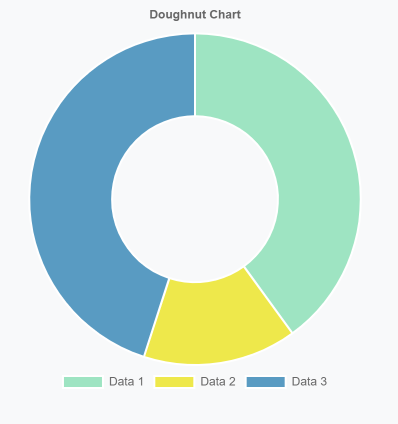
Doughnut
import { Component } from '@angular/core';

@Component({
  selector: 'app-chart-demo',
  template: `
    <abp-chart
      type="doughnut"
      [data]="data"
      [options]="options"
      width="400px"
      height="400px"
    ></abp-chart>
  `,
})
export class ChartDemoComponent {
  data = {
    labels: ['Data 1', 'Data 2', 'Data 3'],
    datasets: [
      {
        label: 'Dataset 1',
        data: [40, 15, 45],
        backgroundColor: ['#a0e6c3', '#f0ea4c', '#5b9dc3'],
      },
    ],
  };

  options = {
    plugins: {
      title: {
        display: true,
        text: 'Doughnut Chart',
        fontSize: 16,
      },
      legend: {
        position: 'bottom',
      },
    },
  };
}
Result:
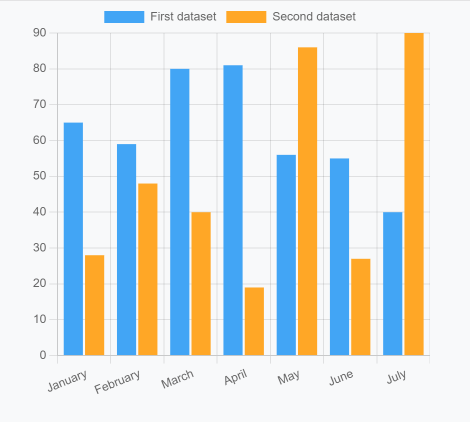
Bar
import { Component } from '@angular/core';

@Component({
  selector: 'app-chart-demo',
  template: `
    <abp-chart
      type="bar"
      [data]="data"
      width="400px"
      height="400px"
    ></abp-chart>
  `,
})
export class ChartDemoComponent {
  data = {
    labels: ['January', 'February', 'March', 'April', 'May', 'June', 'July'],
    datasets: [
      {
        label: 'First dataset',
        backgroundColor: '#42A5F5',
        data: [65, 59, 80, 81, 56, 55, 40],
      },
      {
        label: 'Second dataset',
        backgroundColor: '#FFA726',
        data: [28, 48, 40, 19, 86, 27, 90],
      },
    ],
  };
}
Result:
Radar
import { Component } from '@angular/core';

@Component({
  selector: 'app-chart-demo',
  template: `
    <abp-chart
      type="radar"
      [data]="data"
      width="400px"
      height="400px"
    ></abp-chart>

    <button class="btn btn-primary-outline mt-4" (click)="addDataset()">
      Add dataset
    </button>
  `,
})
export class ChartDemoComponent {
  data = {
    labels: [
      'January',
      'February',
      'March',
      'April',
      'May',
      'June',
      'July',
      'August',
      'September',
      'October',
      'November',
      'December',
    ],
    datasets: [
      {
        label: 'Dataset 1',
        backgroundColor: 'rgba(179,181,198,0.2)',
        borderColor: 'rgba(179,181,198,1)',
        data: [65, 59, 90, 81, 56, 55, 40, 35, 82, 51, 62, 95],
      },
      {
        label: 'Dataset 2',
        backgroundColor: 'rgba(255,99,132,0.2)',
        borderColor: 'rgba(255,99,132,1)',
        data: [28, 48, 40, 58, 96, 27, 100, 44, 85, 77, 71, 39],
      },
    ],
  };

  addDataset() {
    this.data = {
      ...this.data,
      datasets: [
        ...this.data.datasets,
        {
          label: 'Dataset 3',
          backgroundColor: 'rgba(54,162,235,0.2)',
          borderColor: 'rgba(54, 162, 235, 1)',
          data: [90, 95, 98, 91, 99, 96, 89, 95, 98, 93, 92, 90],
        },
      ],
    };
  }
}
Result:
See the chart.js samples for more examples.
API
abp-chart
Properties
| Name | Description | Type | Default |
|---|---|---|---|
[type] |
Type of the chart. | string |
null |
[data] |
Chart data to display | any |
null |
[options] |
Chart options to customize | any |
null |
[plugins] |
Chart plugins to customize behaviour | any |
null |
[width] |
Witdh of the chart | string |
null |
[height] |
Height of the chart | string |
null |
[responsive] |
Whether the chart is responsive | boolean |
true |
(dataSelect) |
A callback that executes when an element on the chart is clicked | EventEmitter<any> |
- |
(initialized) |
A callback that executes when the chart is initialized | EventEmitter<boolean> |
- |
Methods
| Name | Description | Parameters |
|---|---|---|
refresh |
Redraws the chart | - |
reinit |
Destroys the chart then creates it again | - |
getBase64Image |
Returns a base 64 encoded string of the chart in it's current state | - |
generateLegend |
Returns an HTML string of a legend for the chart | - |
getCanvas |
Returns the canvas HTML element | - |
 08-09 May


