ABP Studio: Monitoring Applications
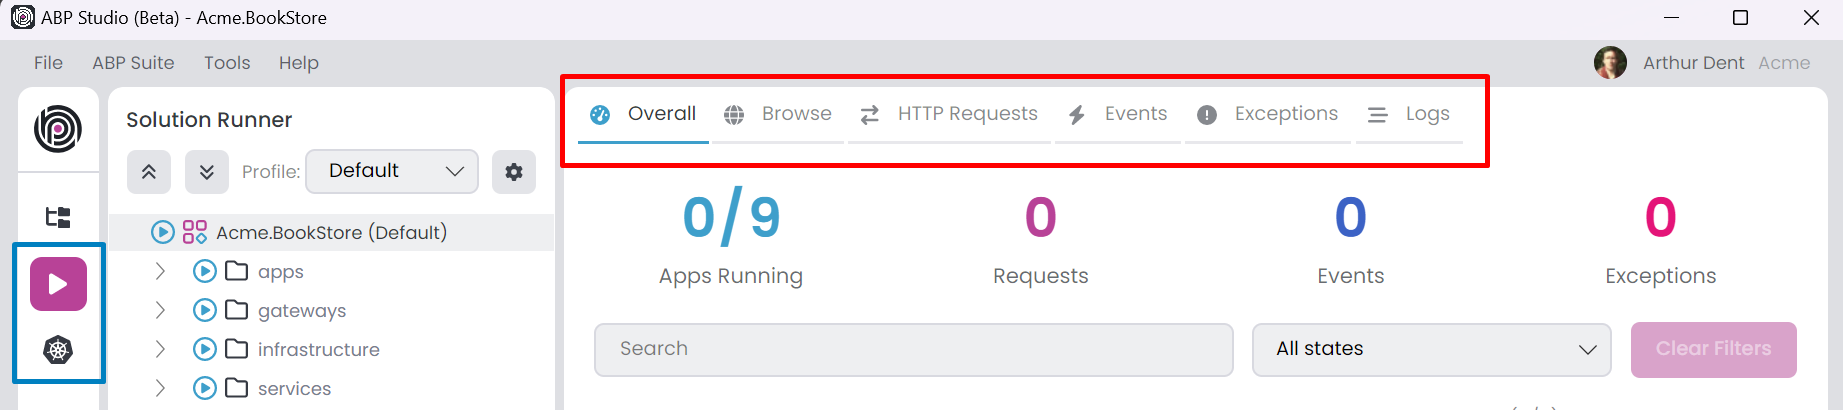
ABP Studio offers a comprehensive centralized monitoring solution, enabling you to oversee all applications from a single interface. To see the monitoring tabs you can select the Solution Runner or Kubernetes from the left menu, monitoring tabs are automatically opened in the center. You can start the applications for monitoring. Various monitoring options are available, including Overall, Browse, HTTP Requests, Events, Exceptions, Logs.
Collecting Telemetry Information
There are two application types: C# and CLI. Only C# applications can establish a connection with ABP Studio and transmit telemetry information via the Volo.Abp.Studio.Client.AspNetCore package. However, we can view the Logs and Browse (if there is a Launch URL) for both CLI and C# application types. Upon starting C# applications, they attempt to establish a connection with ABP Studio. When connection successful, you should see a chain icon next to the application name in Solution Runner. Applications can connect the ABP Studio with Solution Runner -> C# Application -> Run -> Start or from an outside environment such as debugging with Visual Studio. Additionally, they can establish a connection from a Kubernetes Cluster through the ABP Studio Kubernetes Integration: Connecting to the Cluster.
You can configure the AbpStudioClientOptions to disable send telemetry information. The package automatically gets the configuration from the IConfiguration. So, you can set your configuration inside the appsettings.json:
StudioUrl: The ABP Studio URL for sending telemetry information. Mostly, you don't need to change this value. The default value ishttp://localhost:38271.IsLinkEnabled: If this value istrue, it starts the connection to ABP Studio and transmits telemetry information. You can switch this tofalsefor deactivation. In a production deployment, you should explicitly set this value tofalse. The default value istrue.
"AbpStudioClient": {
 "StudioUrl": "http://abp-studio-proxy:38271",
 "IsLinkEnabled": false
}
Alternatively you can configure the standard Options pattern in the ConfigureServices method of the YourApplicationModule class.
public override void ConfigureServices(ServiceConfigurationContext context)
{
    Configure<AbpStudioClientOptions>(options =>
    {
        options.IsLinkEnabled = false;
        //options.StudioUrl = "";
    });
}
Overall
In this tab, you can view comprehensive overall information. You have the option to search by application name and filter by application state. To reset all filters, use the Clear Filters button. When you apply a filter header informations gonna refresh by filtered applications.
Apps Running: The number of applications running. It includes CLI and C# applications. In the example two C# microservice applications and one CLI application is running.Requests: The number of HTTP requests received by all C# applications.Events: The number of Distributed Event sent or received by all C# applications.Exceptions: The number of exceptions thrown by all C# applications.
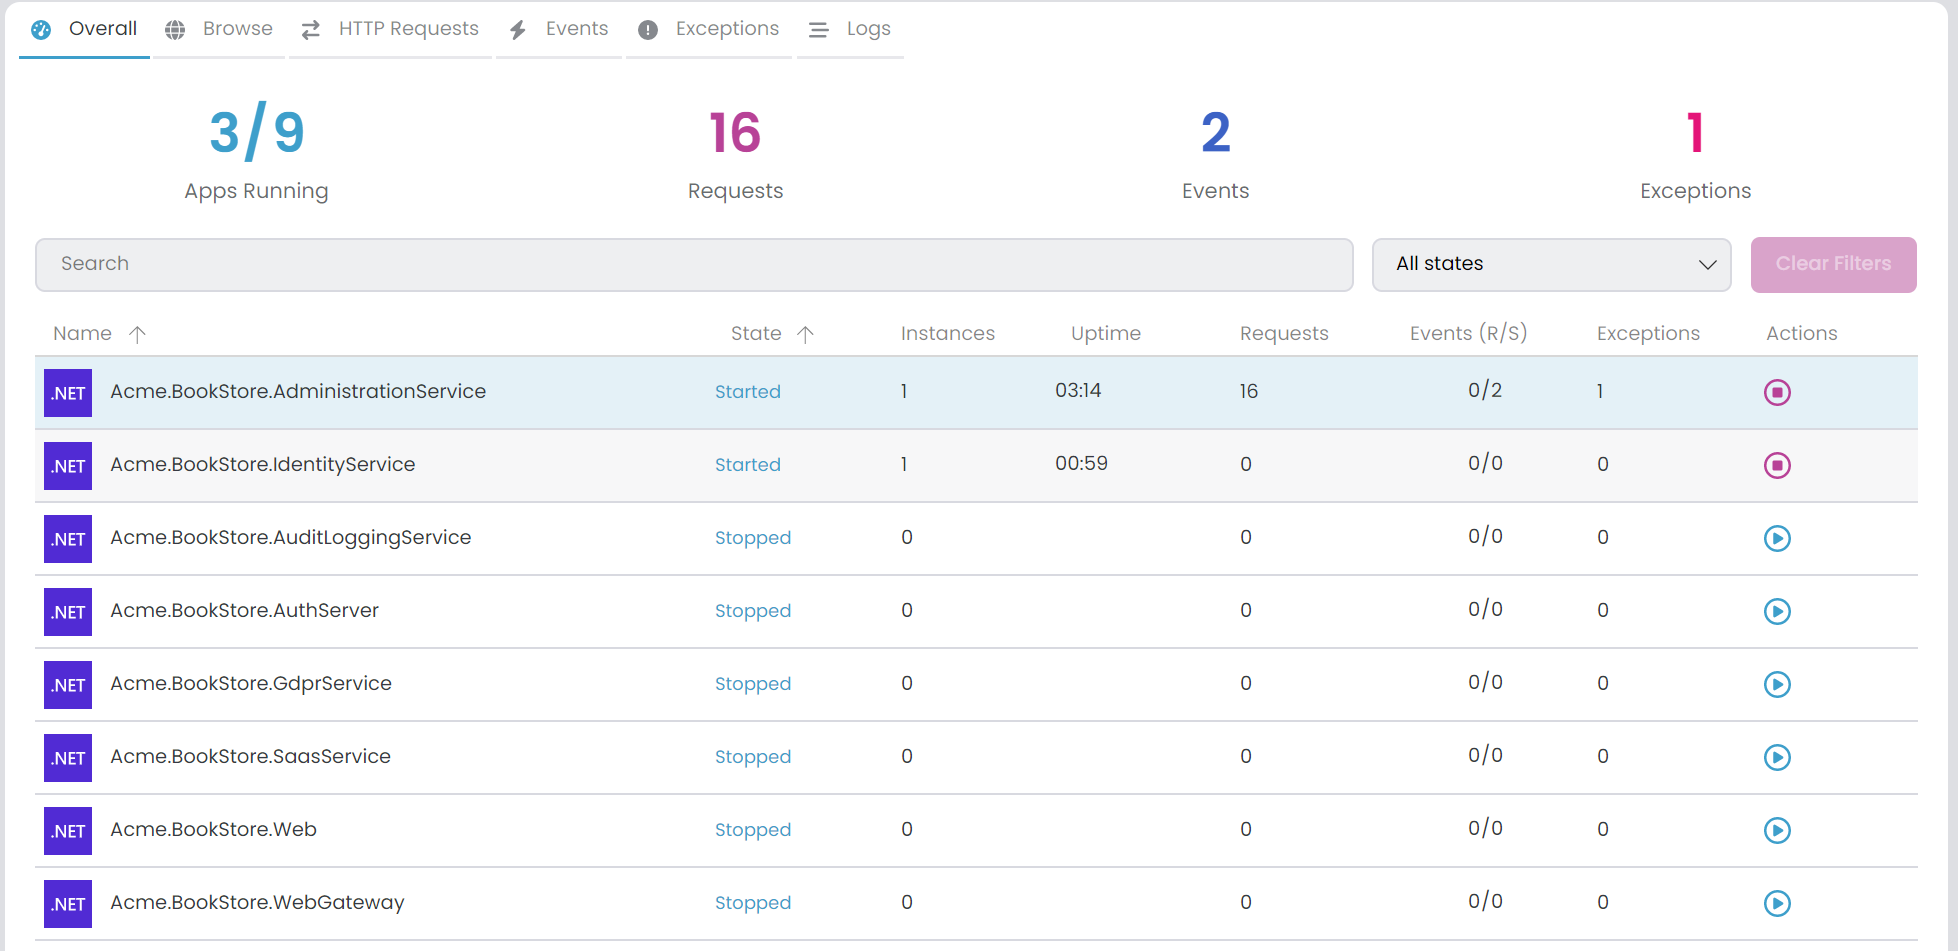
In the data grid, details for each application are displayed. It's possible to sort rows by columns. When selecting a row, you can right-click to access the context menu, offering various actions. This menu allows for opening related tabs that are filtered by the selected application.
Name: The name of the application.State: The state of the application. It can take on several values such as Scheduled, Starting, Started, Stopping and Stopped. In the event of an application crash during its starting, the state is mark as Scheduled, we can cancel the starting process at that stage.Instances: Indicates the count of running instances for the application. This value is particularly helpful when scaling the application within a Kubernetes, providing visibility into the number of currently active instances.Uptime: The time elapsed since the application started.Requests: The number of HTTP requests received by the application.Events (R/S): The number of Distributed Event received or sent by the application.Exceptions: The number of exceptions thrown by the application.Actions: The actions that can be performed on the application. You can start and stop the application.
For the events system, you can exclusively view the Distributed Events. Generally, the Local Events is not included.
Browse
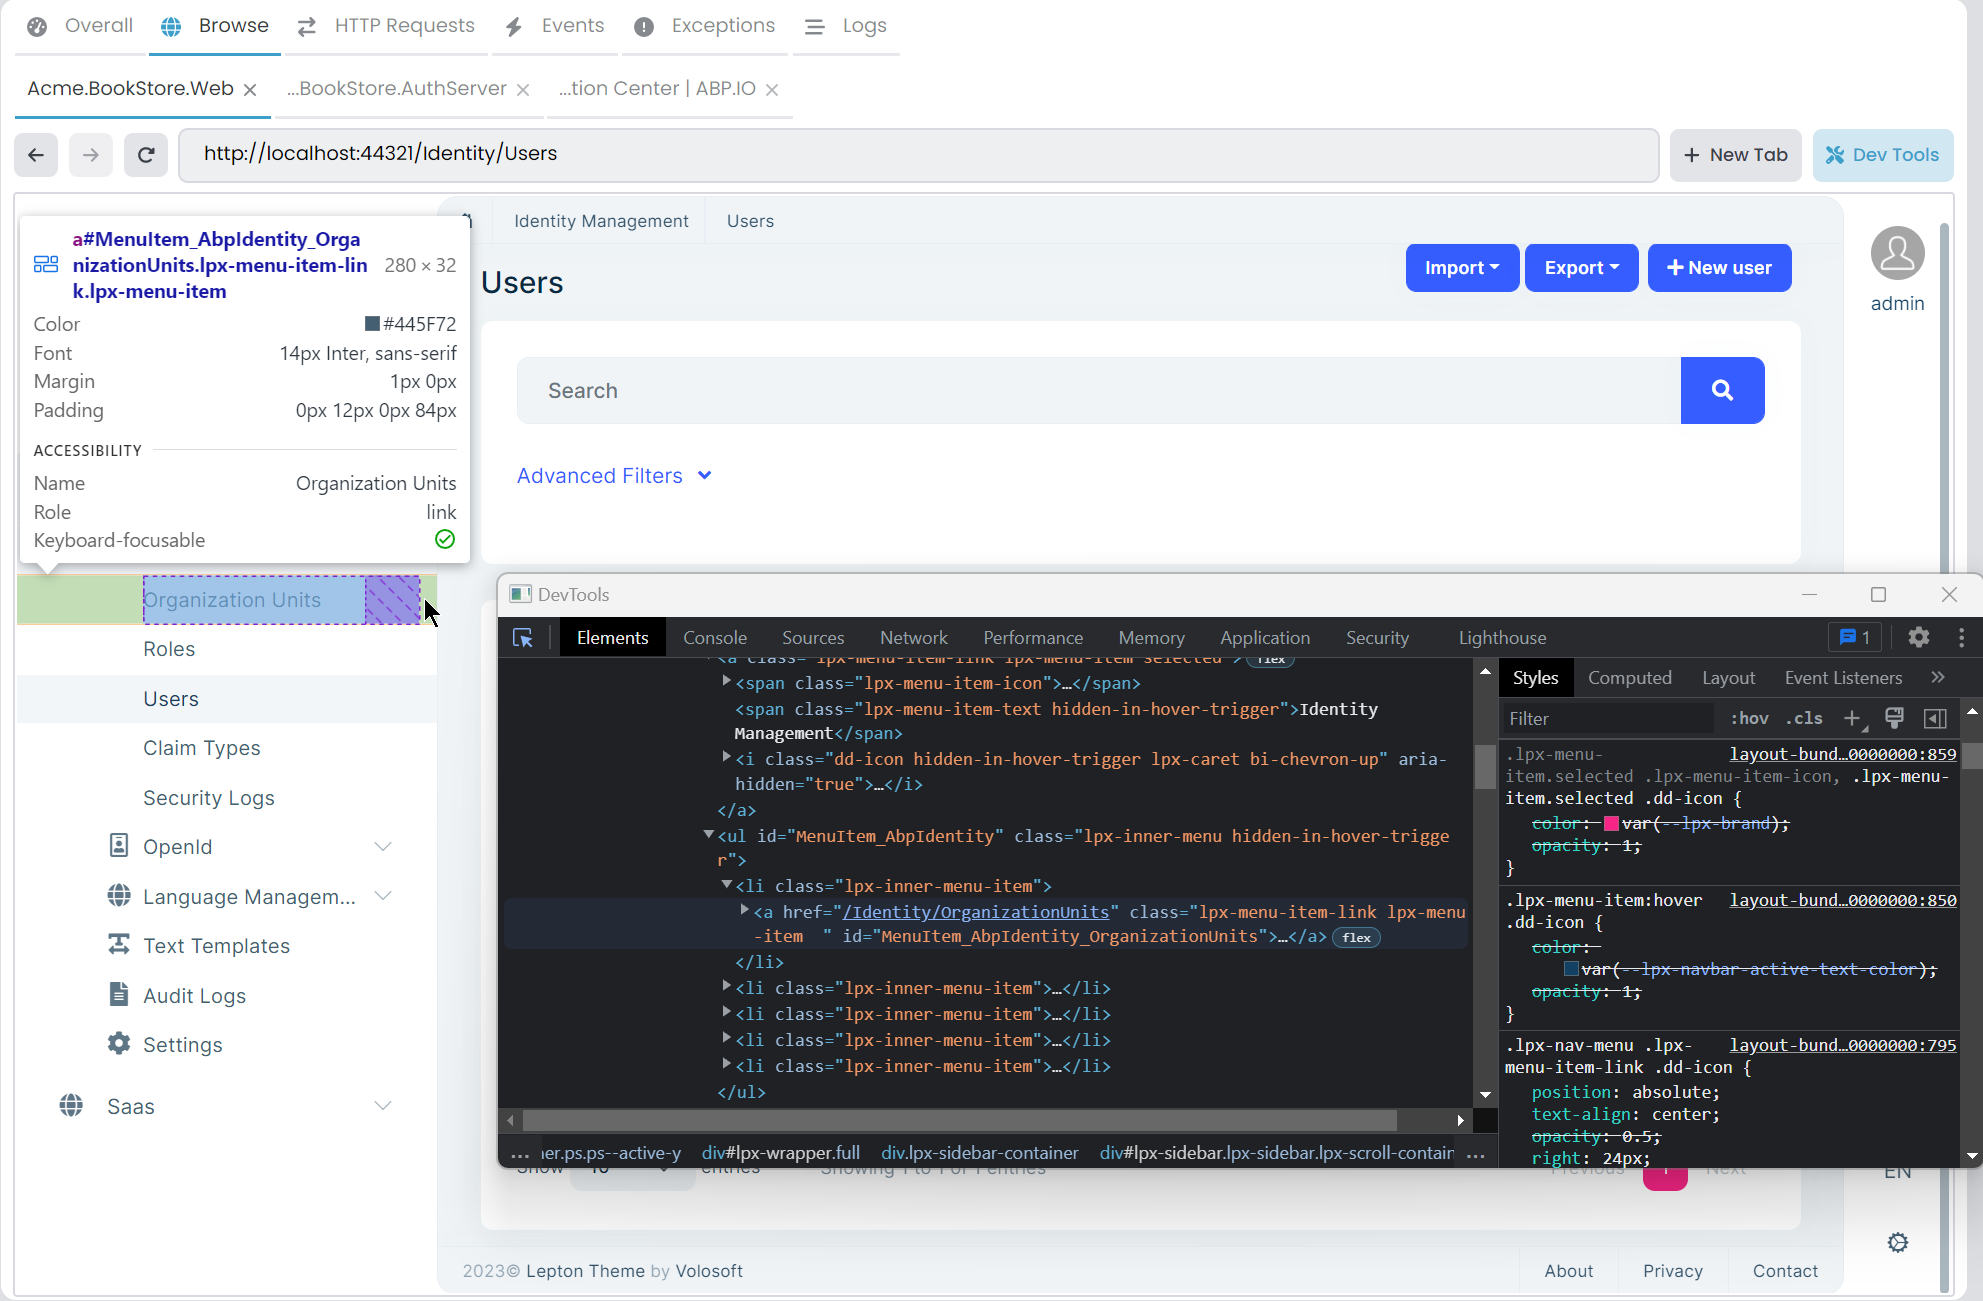
ABP Studio includes a browser tool that allows access to websites and running applications. You can open new tabs to browse different websites or view active applications. It's a convenient utility to access websites and applications without leaving ABP Studio. Clicking the Browse tab displays the running applications and an Open new tab button.
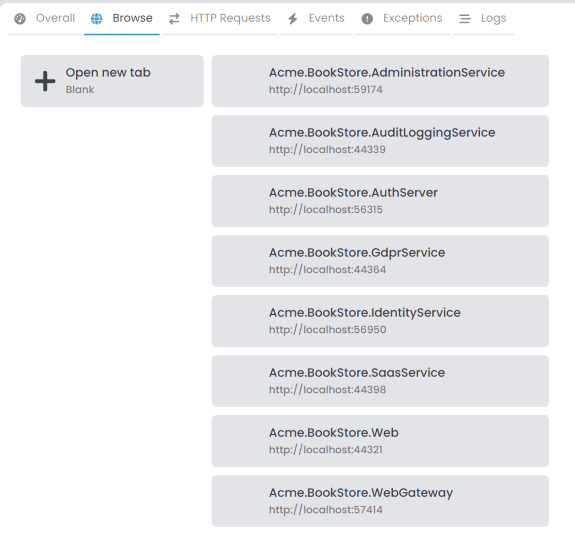
You can open the Browse tabs as many times as you want. It's possible to open the same application in several tabs simultaneously. To open an application, navigate through Solution Runner -> C# or CLI Application -> Browse. This option is only visible when there is a Launch URL. Additionally, you can access any URL by entering it into the address bar.
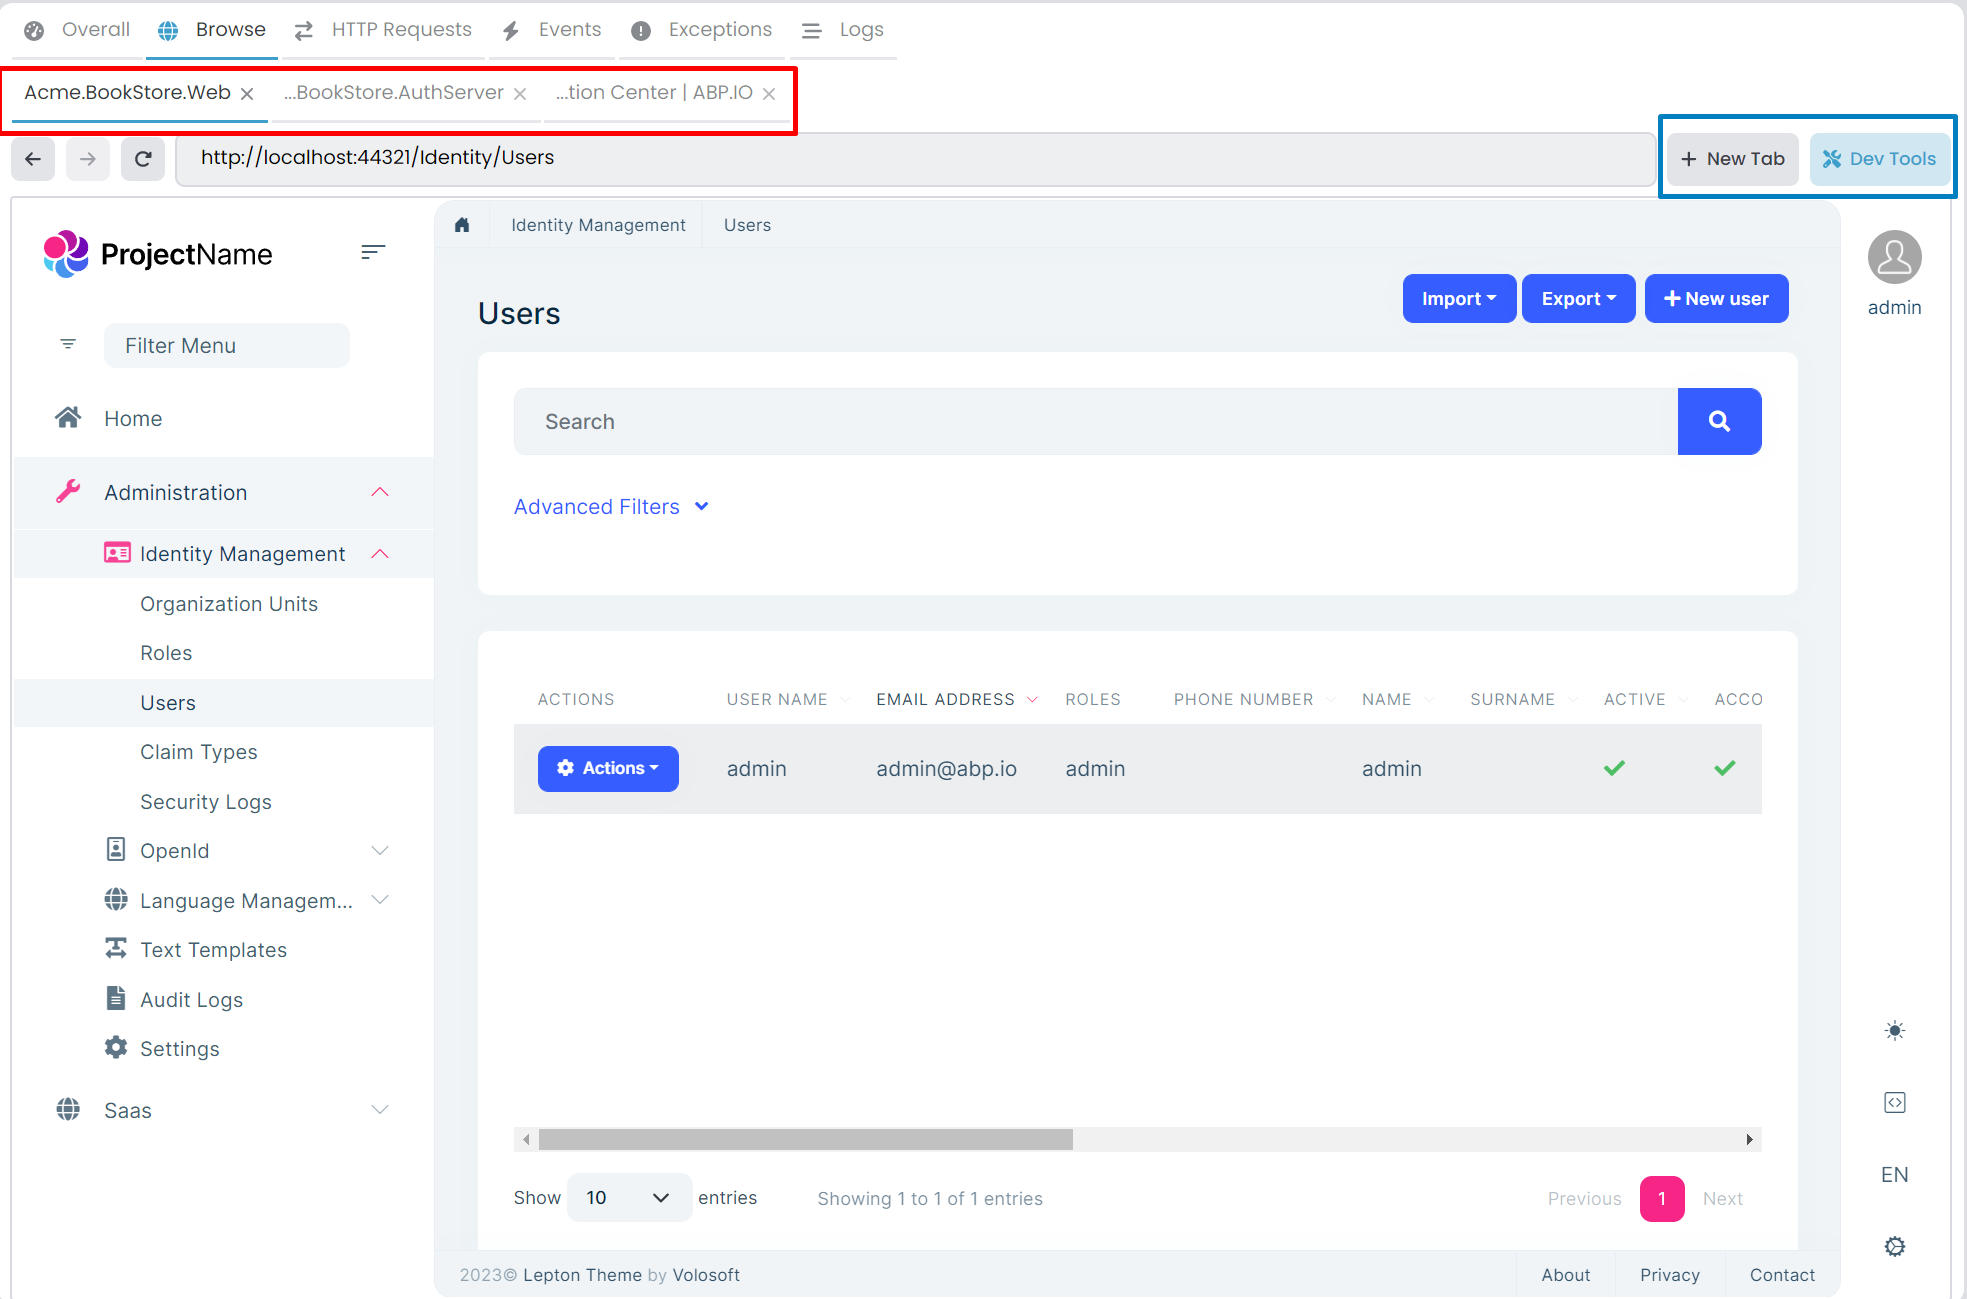
When you click the Dev Tools button it opens the Chrome DevTools for the selected tab.
HTTP Requests
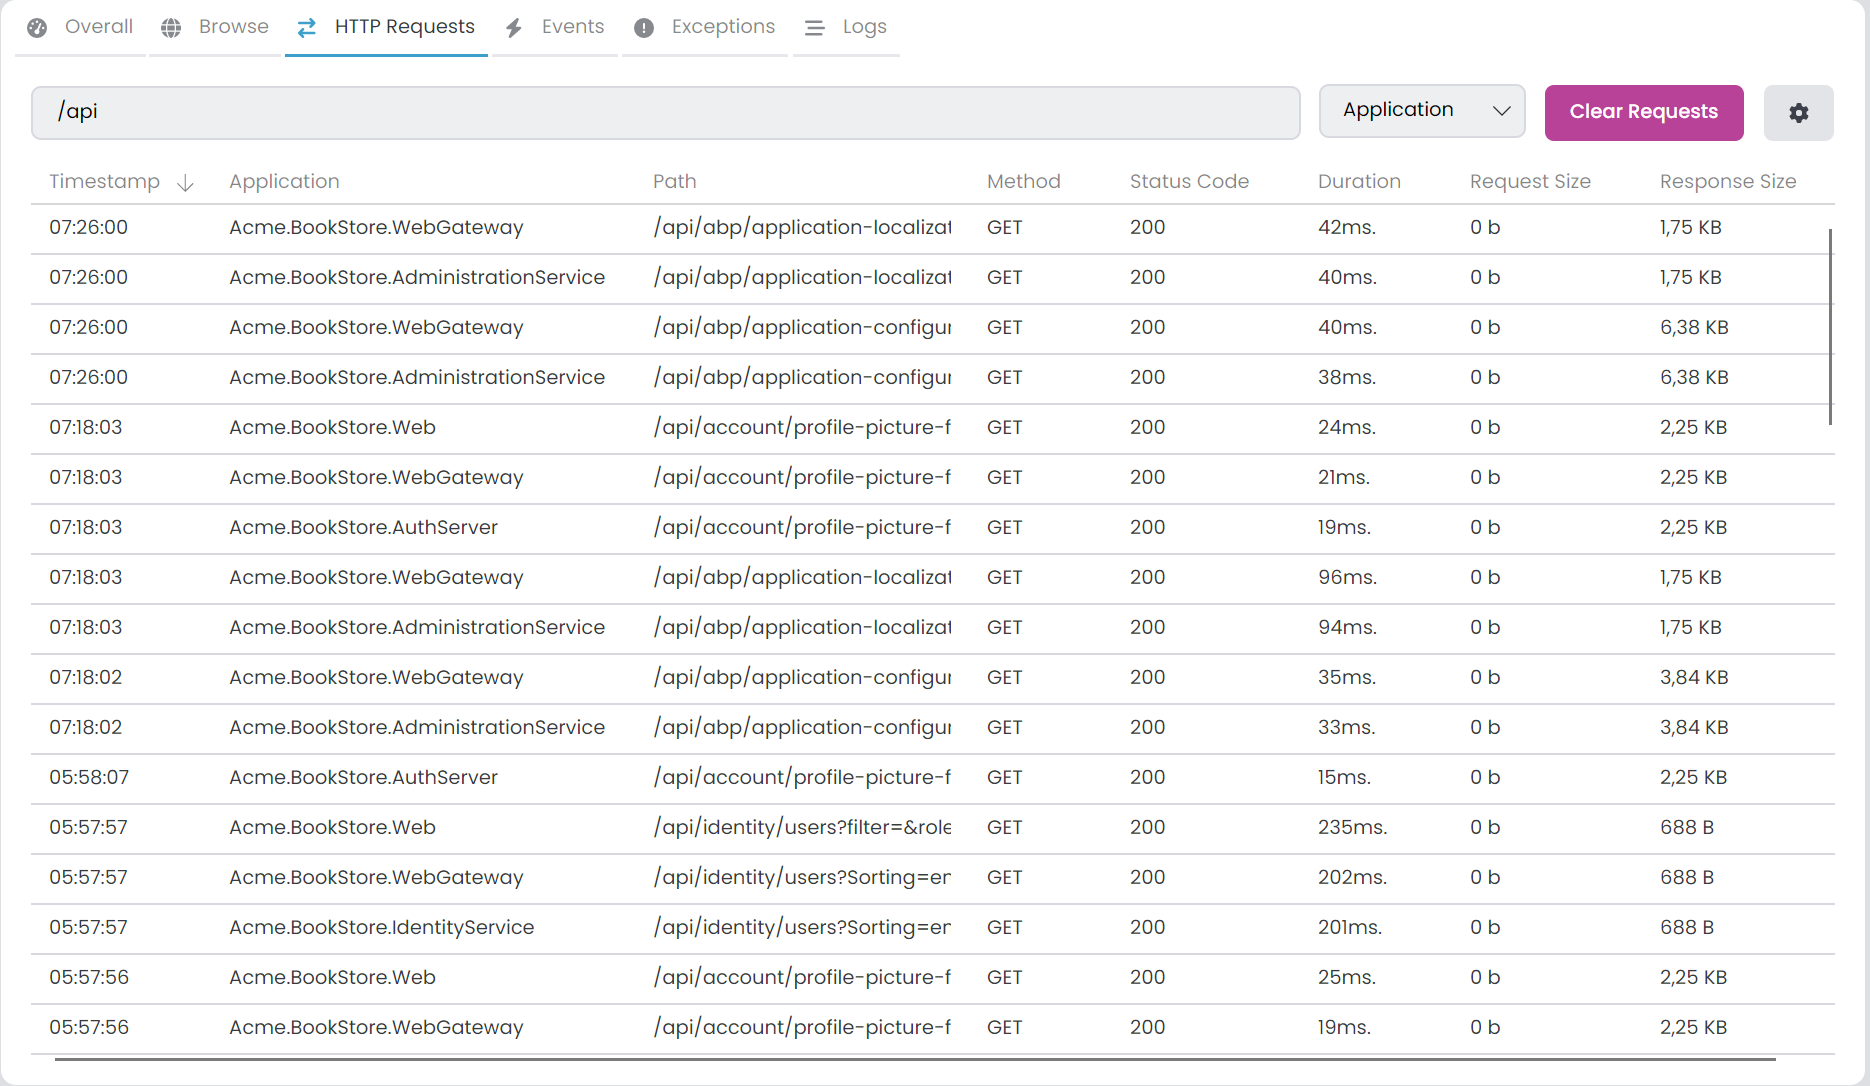
Within this tab, you can view all HTTP Requests received by your C# applications. You have the option to filter requests based on URLs by using the search textbox or by selecting a particular application from the combobox. The Clear Requests button removes all received requests. Moreover, you have the ability to sort requests by columns.
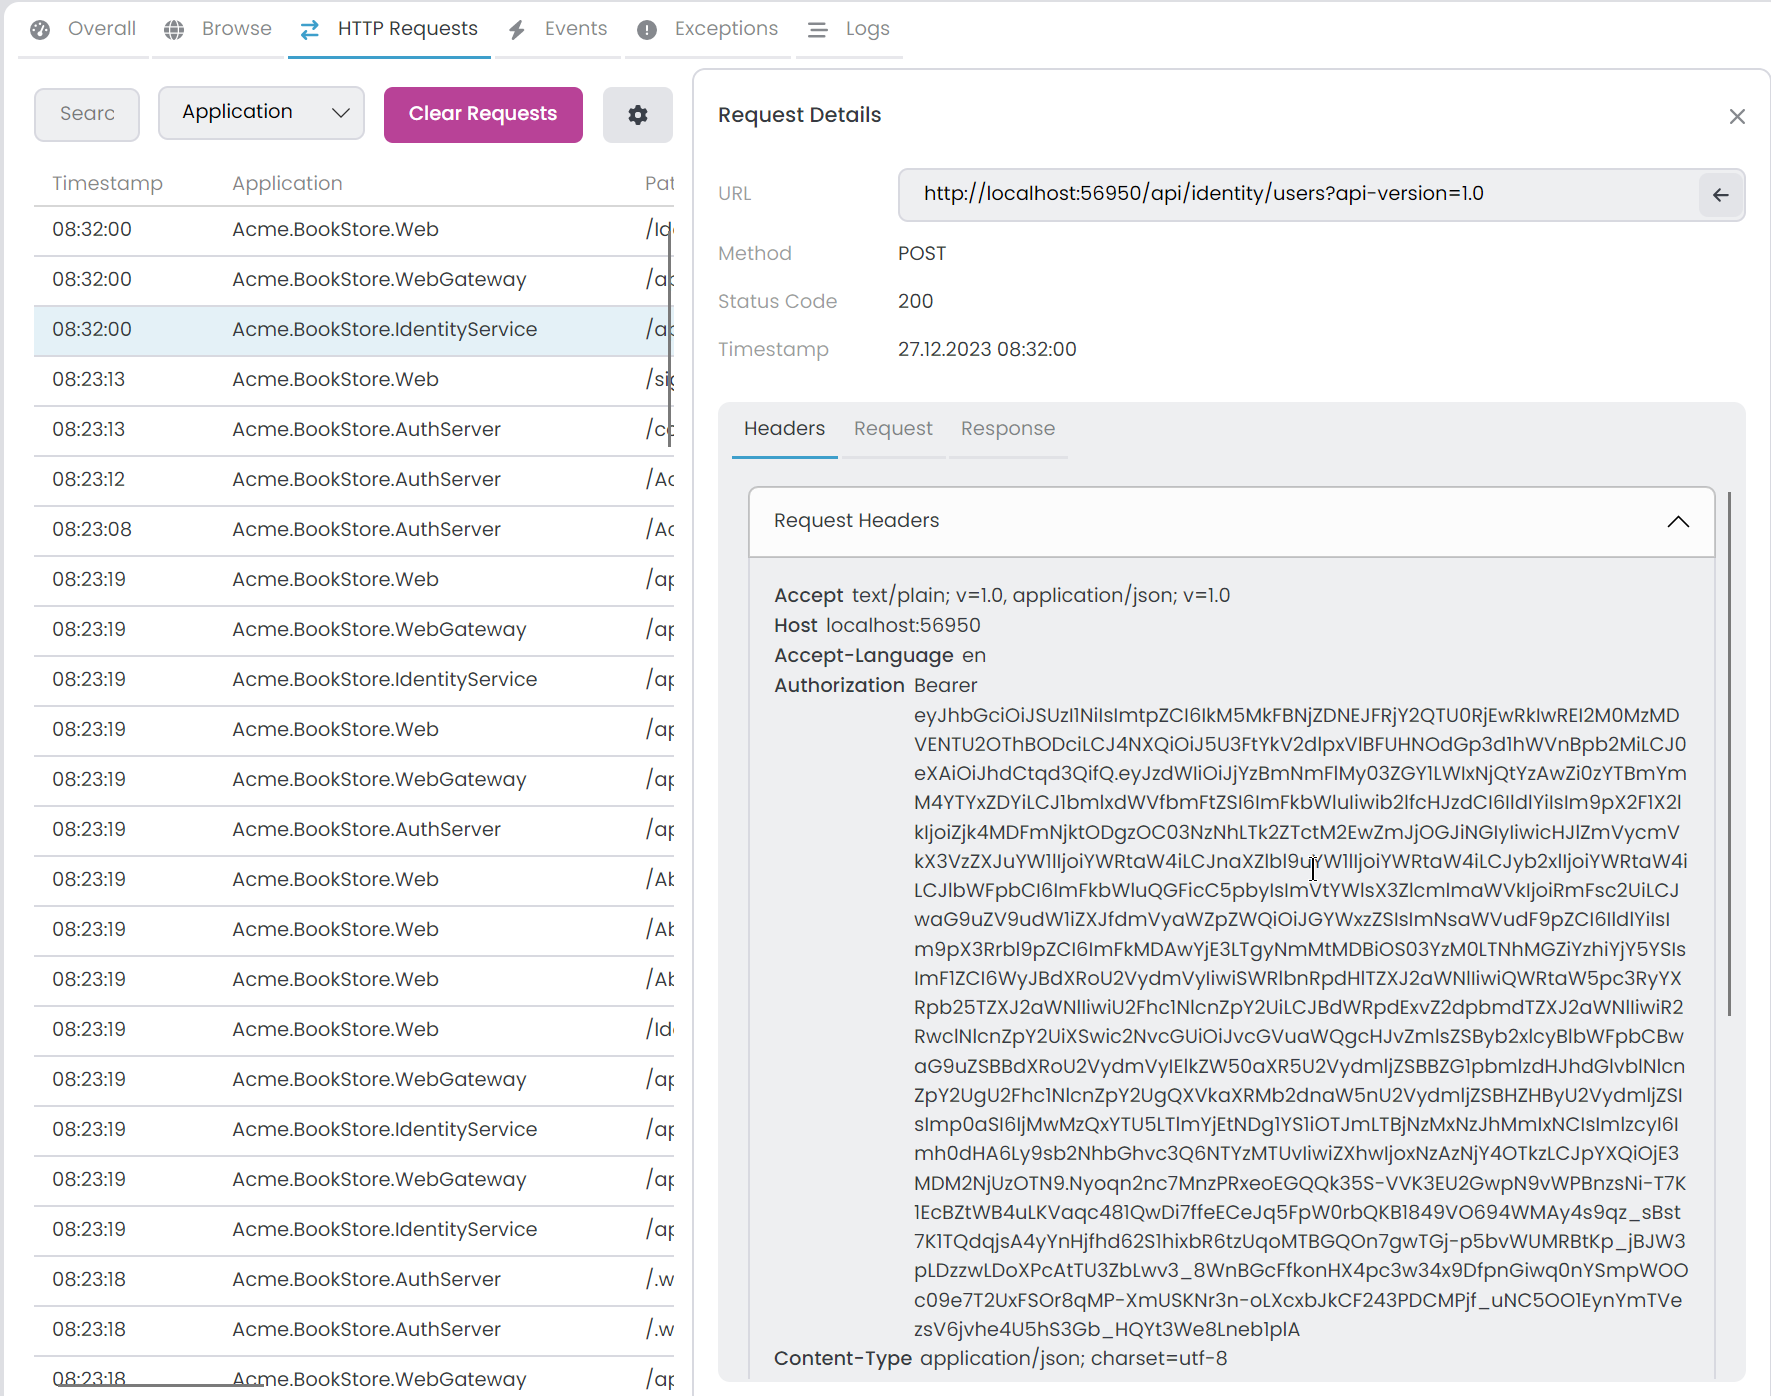
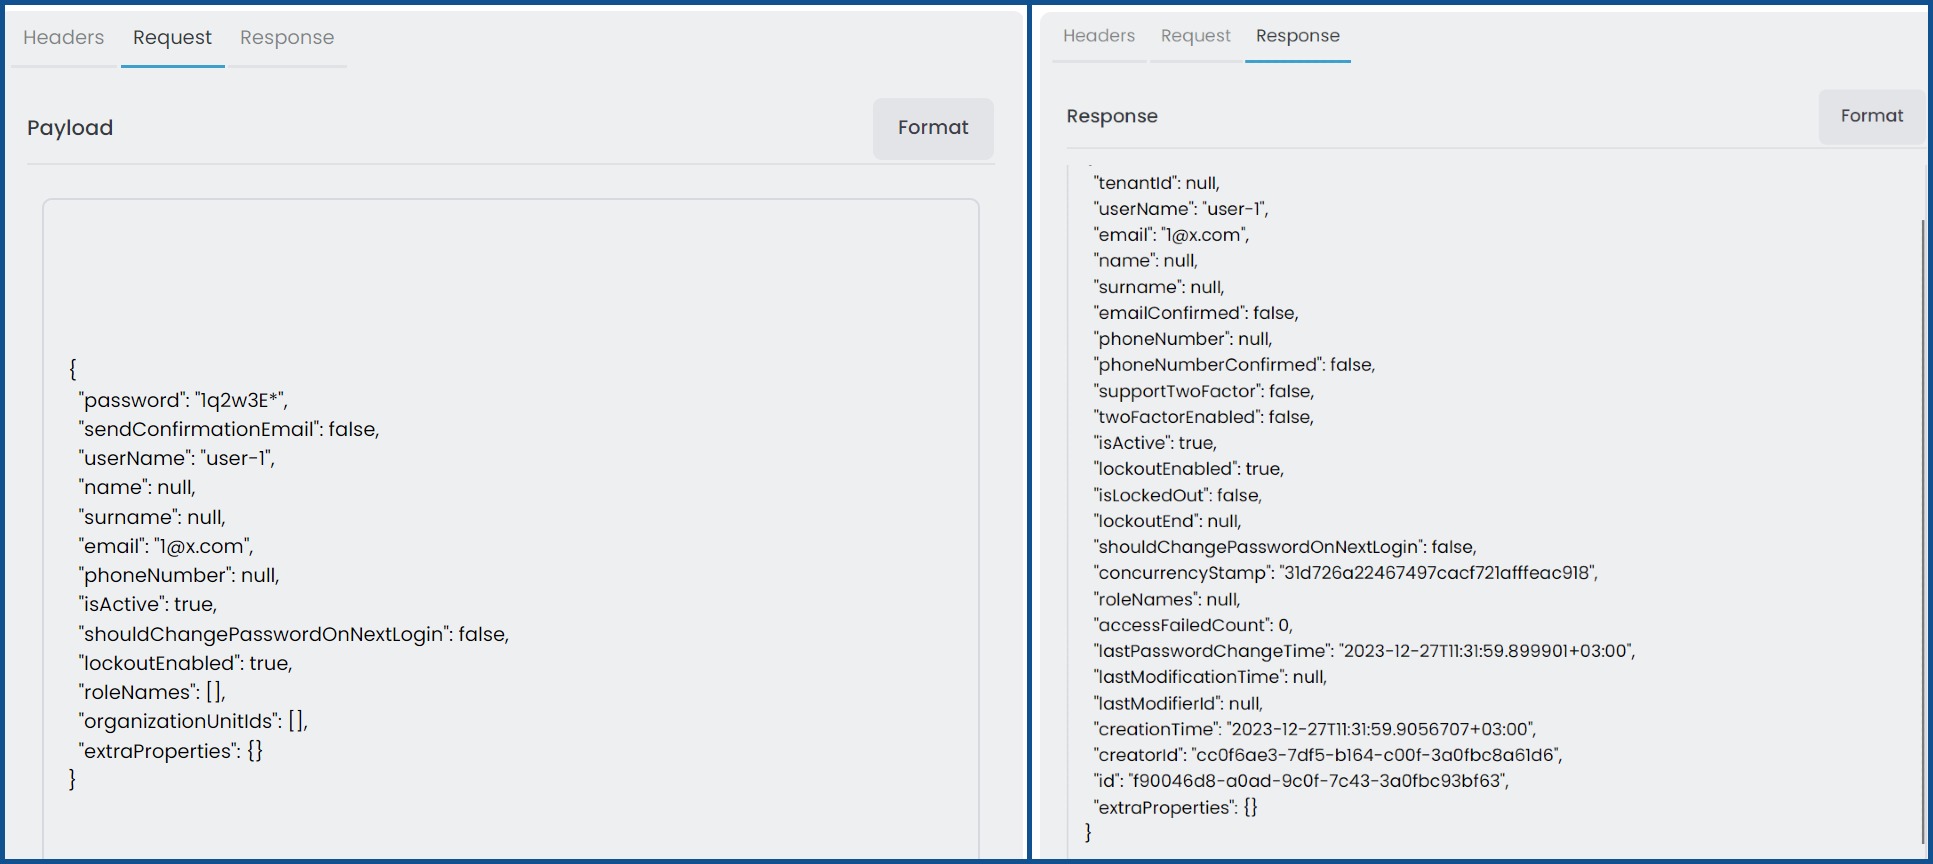
Clicking on a row enables you to view the details of each HTTP request; URL, Method, Status Code, Timestamp, Headers (Request, Response), Request (Payload) and Response.
You can format the JSON content by clicking the Format button.
Furthermore, by clicking the gear icon in the HTTP Requests tab, you can access the Solution Runner HTTP Requests Options window. Within the Ignored URLs tab, you have the ability to exclude particular URLs by applying a regex pattern. Excluded URLs won't be visible in the HTTP Requests tab. By default, the metrics URL is already ignored. You can add or remove items as needed.
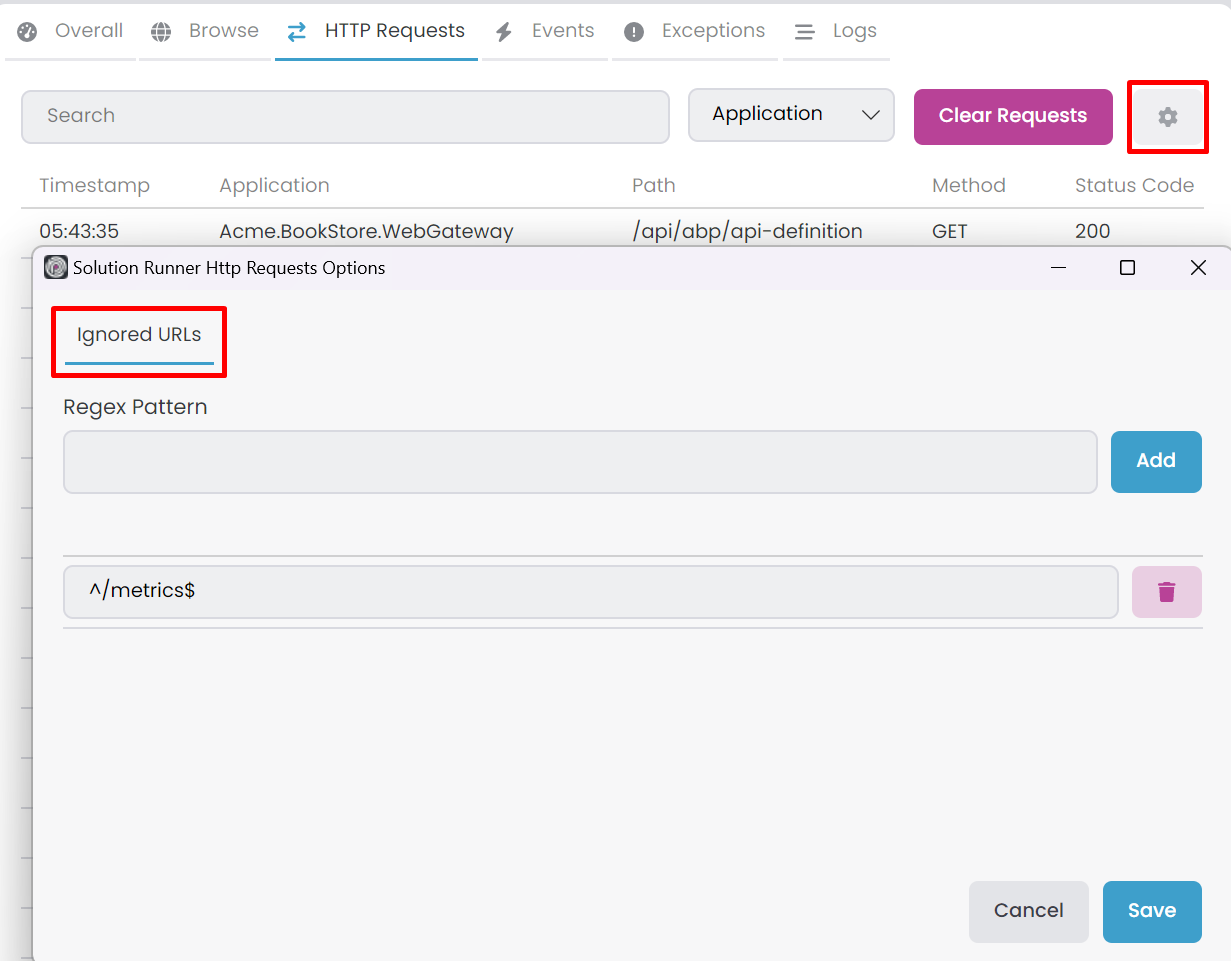
After adding a new URL, it will only affect subsequent requests.
Events
In this tab, you can view all Distributed Events sent or received by your C# applications. You can filter them by Event Name using the search textbox or by selecting a specific application. Additionally, you can choose the Direction (Received/Send) and Source (Direct/Inbox/Outbox) of events. The Clear Events button removes all events.
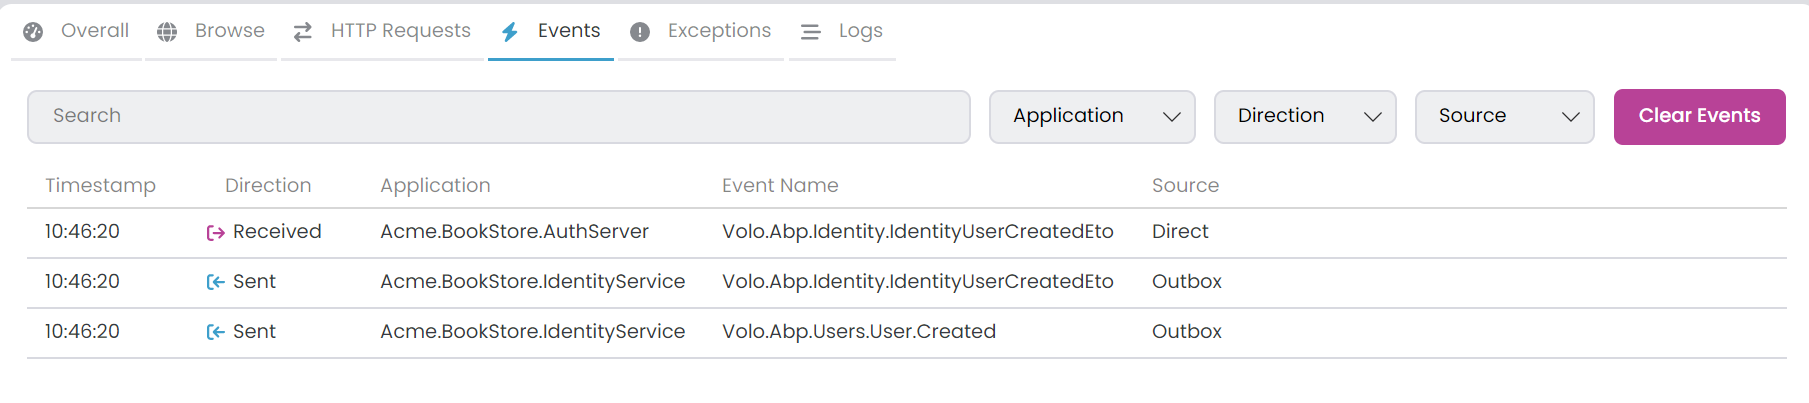
In the Direction section, there are two options: Received, indicating events received by the application, and Sent, indicating events sent by the application. Within the Source section, three options are available, and their significance comes into play when utilizing the Inbox/Outbox pattern. Inbox refers to events received by the application, Outbox refers to events sent by the application and Direct signifies events sent or received by the application without involving Inbox/Outbox pattern.
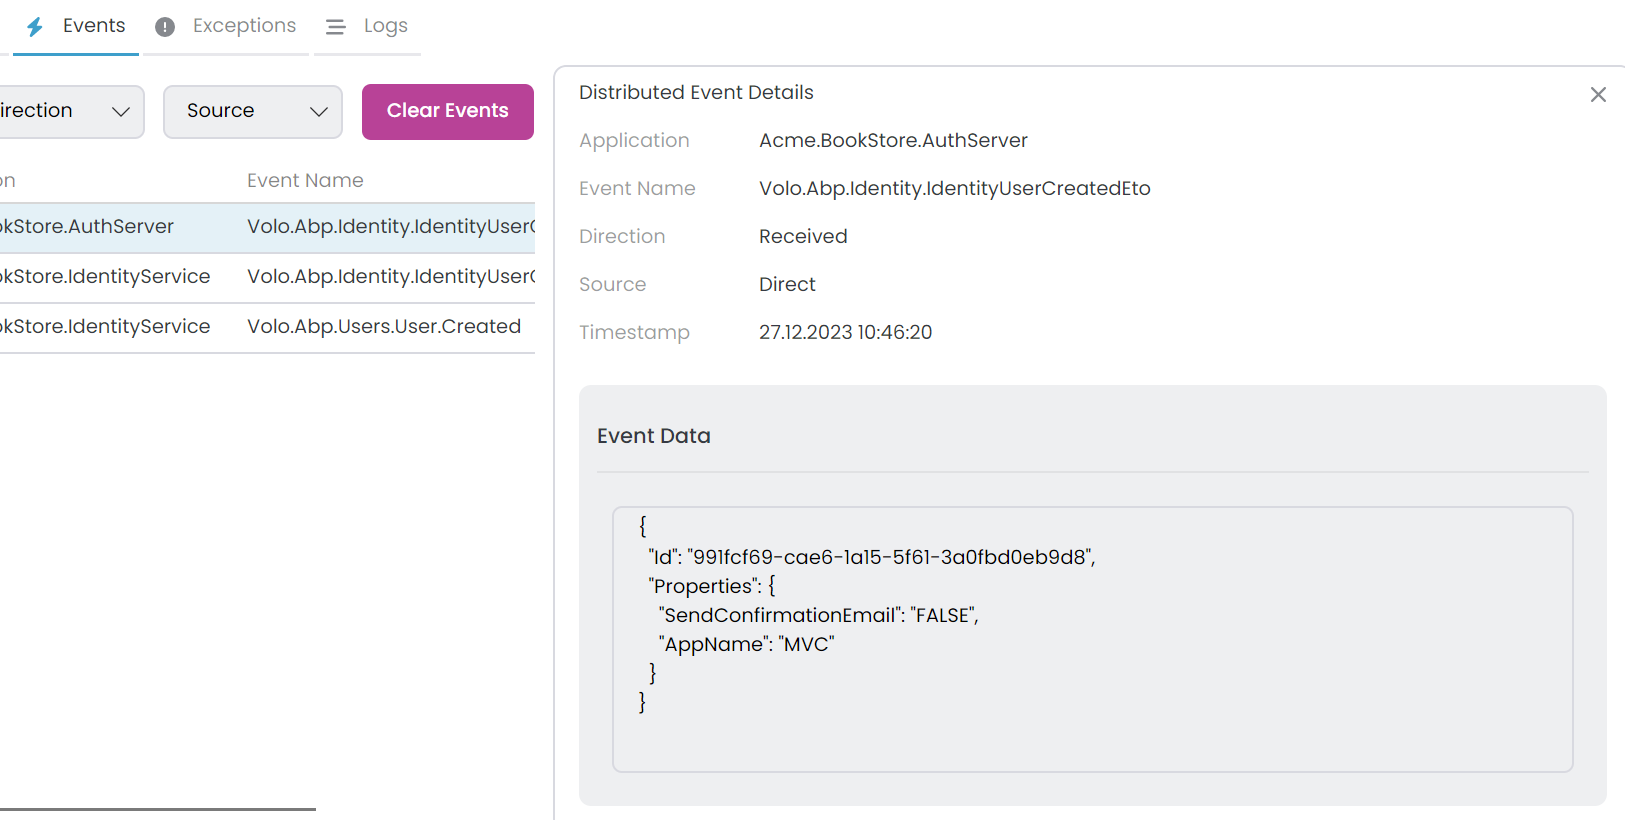
Clicking on a row enables you to view the details of each event; Application, Event Name, Direction, Source, Timestamp and Event Data.
Exceptions
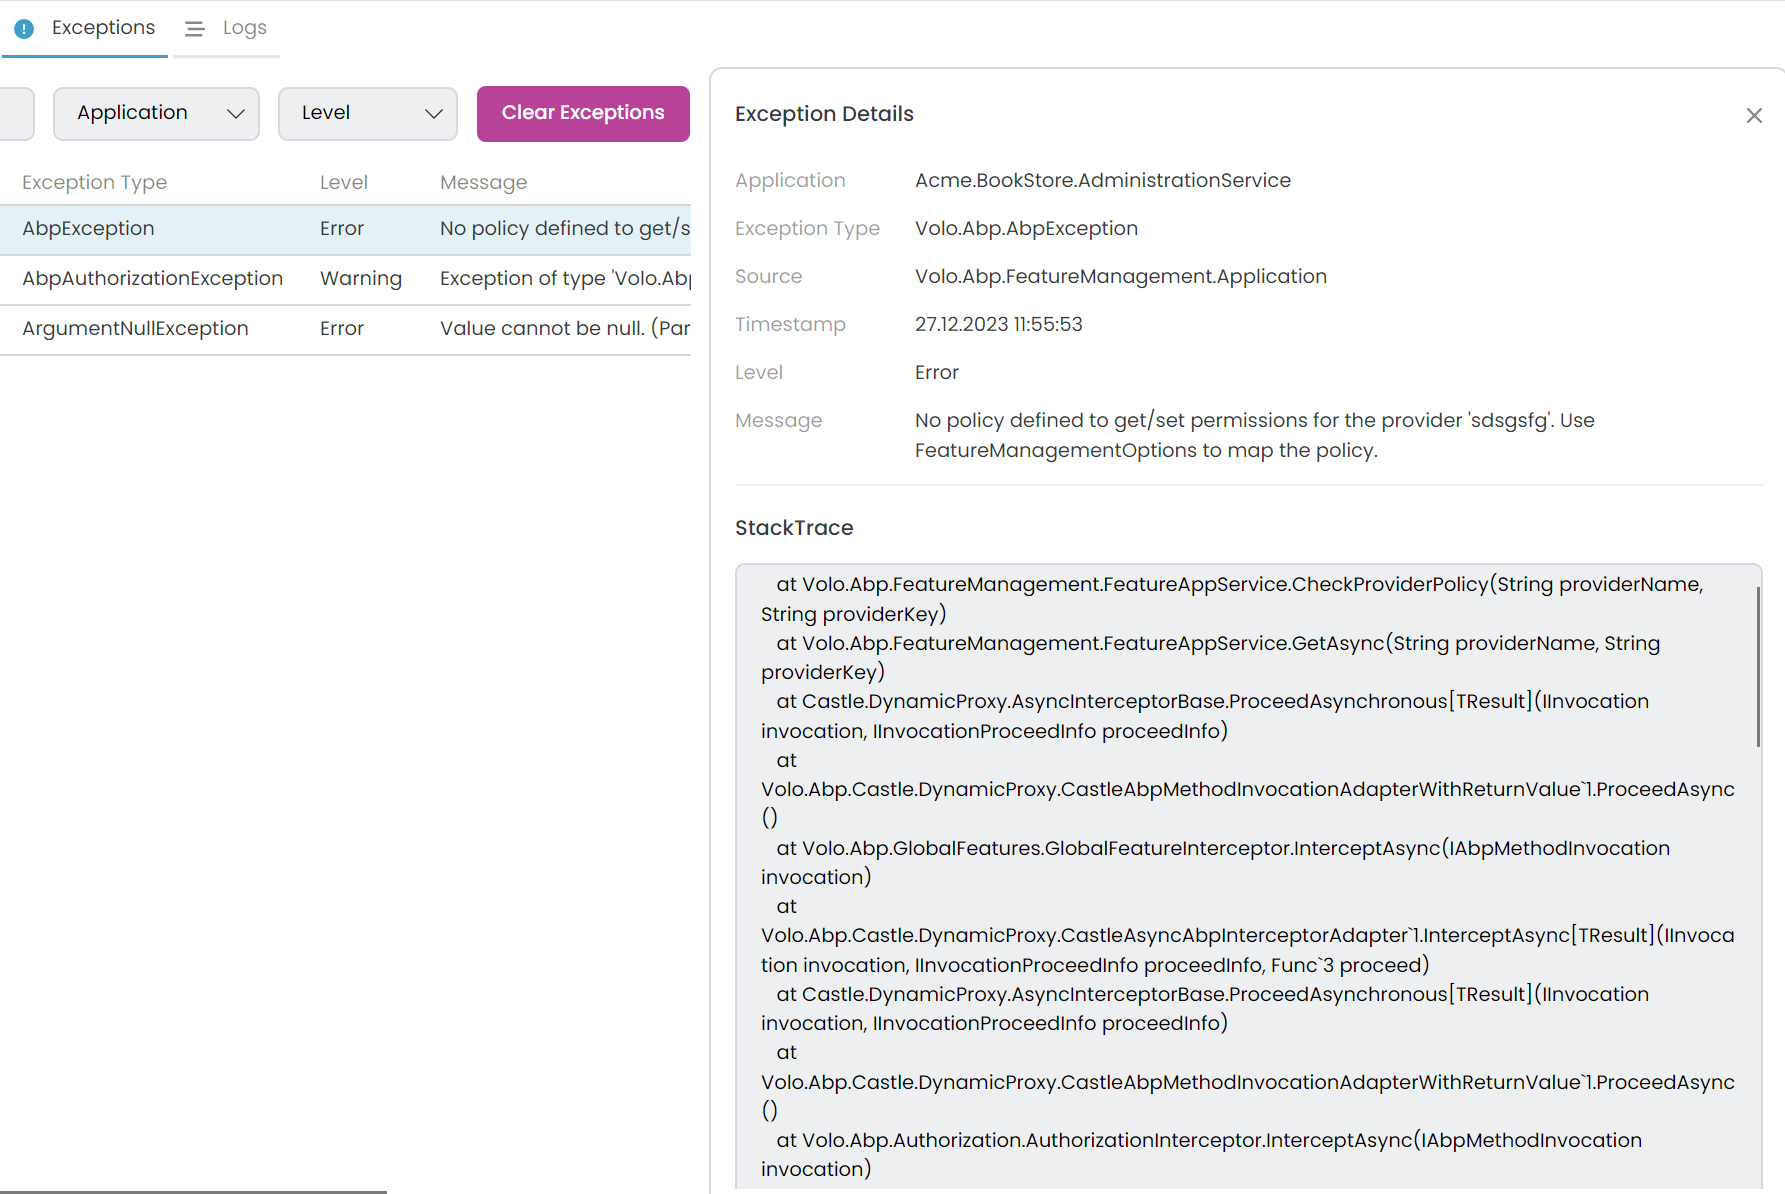
This tab displays all exceptions by your C# applications. You can apply filters using the search textbox based on Message, Source, ExceptionType, and StackTrace or by choosing a specific application. Additionally, you have the option to select the Log Level for adding a filter. To clear all exceptions, use the Clear Exceptions button.
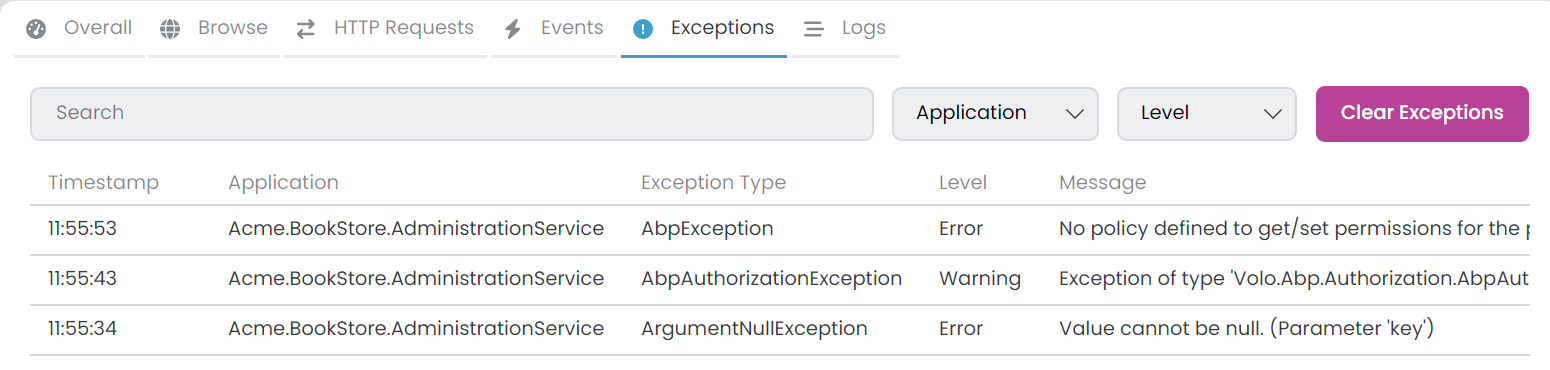
Click on a row to inspect the details of each exception; Application, Exception Type, Source, Timestamp, Level, Message and StackTrace.
Logs
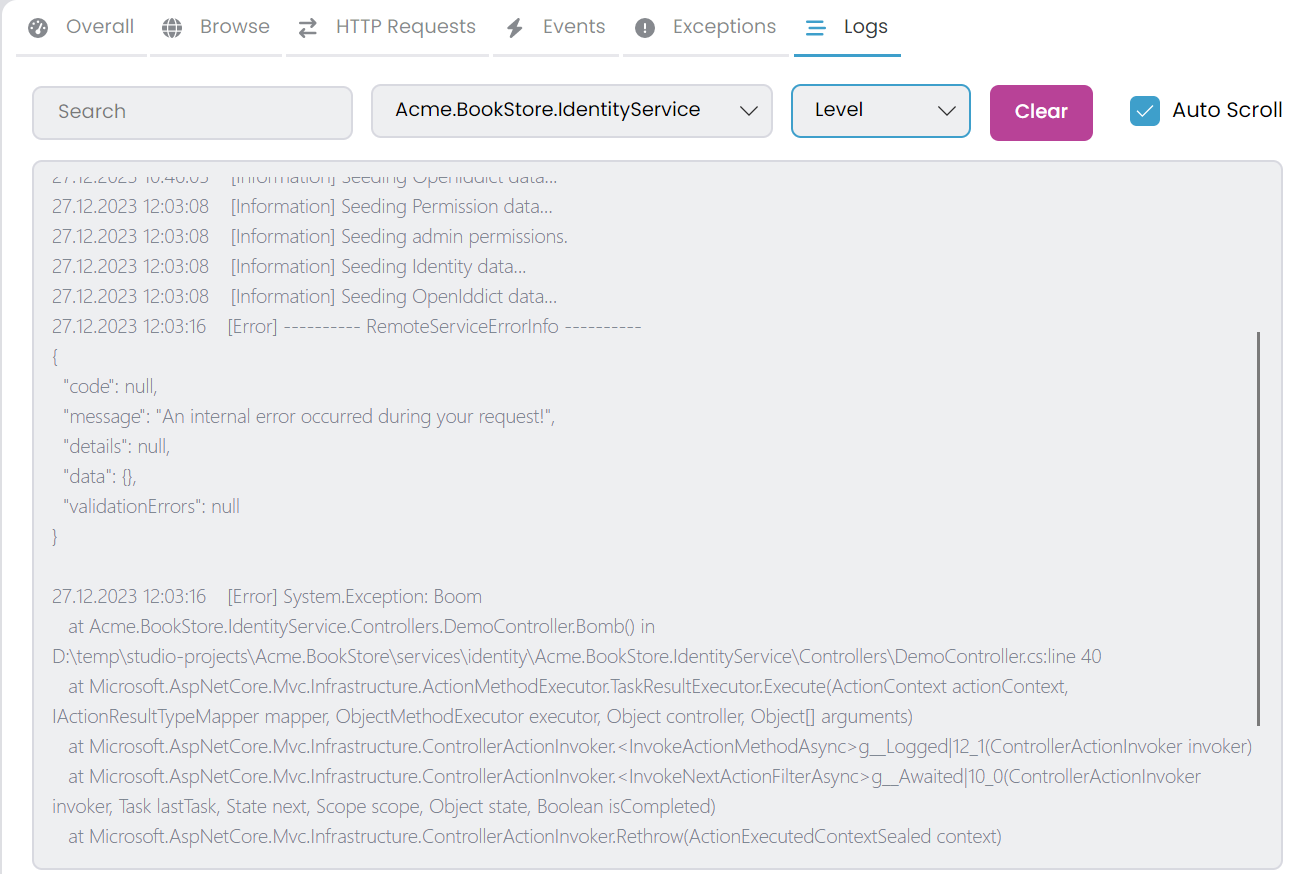
The Logs tab allows you to view all logs for both CLI and C# applications. To access logs, simply select an application. You can also apply filters using the search textbox by log text or by selecting a specific Log Level. When you select a Log Level it shows selected log level and higher log levels. For example, if you select Warning it shows Warning, Error and Critical logs. To clear selected application logs, use the Clear Logs button. If Auto Scroll is checked, the display automatically scrolls when new logs are received.
 08-09 May


